Sunday, June 9, 2013

Understanding ELSA Query Performance

Most queries in ELSA are very fast and complete under a second or two.  However, some queries can take several seconds or even several minutes, and it can be annoying to wait for them.  A recent update to ELSA should help reduce the likelihood of having queries that take longer than a second or two, but understanding what factors are involved with query execution time can help a user to both write better queries and to take full advantage of the new improvements.

First, let's look at what happens when ELSA makes a query.  ELSA uses Sphinx as its search engine, and it uses two types of Sphinx indexes.  The first is a "temporary" index that ELSA initially creates for new logs which stores the fields (technically, attributes) of the events in RAM, deduplicated, using Sphinx's default "extern" docinfo.   The other is the "permanent" form which stores the attributes using Sphinx's "inline" docinfo.  Inline means that the attributes are something like a database table, where the name of the table is the keyword being searched, and all entries in the table correspond to the hits for that keyword.

So let's say we have log entries that look like this:

term1 term2 id=1, timestamp=x1, host=y, class=z
term1 term3 id=2, timestamp=x2, host=y, class=z

Sphinx's inline docinfo would store this as three total keywords, each with the list of attributes beneath it like a database table:

term1
id | timestamp | host | class
1  | x1        | y    | z
2  | x2        | y    | z


term2
id | timestamp | host | class
1  | x1        | y    | z


term3
id | timestamp | host | class
2  | x2        | y    | z

So when you query for +term1 +term2, Sphinx does a pseudo-SQL query like this:

SELECT * FROM term1 JOIN term2 WHERE term1.id=term2.id

Most terms are fairly rare, so the join is incredibly fast.  However, consider a situation in which "term1" appeared in hundreds of millions of events.  If your query includes "term1," then the number of "rows" in the "table" for that term could be millions or even billions, making that JOIN extremely expensive, especially if you've asked for the query to filter the results to specific time values or do a group by.

In addition to the slow querying, note that the disk required to store the Sphinx indexes is a function of the number of attributes it must store in these pseudo-tables.  So, a very common term will incur a massive disk cost to store the large pseudo-table.

Below is the count of the one hundred most common terms in a test dataset of ten million events.  You can think of each bar representing the number of rows in the pseudo-tables, so a query for 0 - (the two most common terms) would require a join across a pseudo-table with 45,355,729 rows multiplied with another with 33,907,455 rows.  Note how quickly the hit count of a given term drops off.


Stopwords

This is where Sphinx stopwords save the day.  Sphinx's indexer has an option to calculate the frequency with which keywords exist in data to be indexed.  You can invoke this by adding --buildstops <outfile> <n> --buildfreqs to the indexing command and it will find the top n most frequent keywords and write them to outfile, along with the count for how many times the keyword appeared.  This file can be referred to by a subsequent run of indexer, sans the stopword options, to ignore these n most frequent keywords.  This will save a massive amount of disk space (expect savings of around 60% percent) and also guarantee that queries including the word won't take forever, because the index won't have any knowledge of them.

However, this obviously means that the keywords can't be searched.  To cope with this, ELSA has a configuration item in the elsa_web.conf file where you can specify a hash of stopwords.  If a query attempts to search one of these keywords, then one of several things can happen:

  1. If some terms are stopwords and some are not, then the query will use the non-stopwords as the basis for the Sphinx search, and results will be filtered using the stopwords in ELSA.
  2. If all terms are stopwords, the query is run against the raw SQL database and Sphinx is not queried at all.
  3. If a query contains no keywords, just attributes (such as a query for just a class or a range query), the query will be run against the raw SQL database and not Sphinx.
Currently, stopwords must be manually created and added, but the optimization code exists in the current ELSA codebase.  I will be adding automatic stopword management in the near future so that all ELSA users will benefit from the massive disk savings and predictable performance that shifting stopword and attribute-only searches to SQL can provide.

Sunday, April 28, 2013

ELSA Resource Utilization

I've recently received a number of questions on the ELSA mailing list, as well as internally at work, regarding hardware sizing and configuration for ELSA deployments.  Creating a good environment for ELSA requires understanding what each component does, what its resource requirements are, and how it interacts with the other components.  Generally speaking, with the new web services architecture, designing an ELSA architecture has become incredibly simple because the ideal layout is for all boxes to have the same components running.  It really is as simple as adding more boxes, with the small nuance of a possible load balancer in front of multiples.  To see why, let's take a closer look at each of the components.

The Components

An ELSA instance consists of three categories of components for receiving logs: parse, write, and index.  Here they are individually:
  1. Syslog-NG receive/parse
  2. elsa.pl parse/write
  3. MySQL load
  4. Sphinx Search index
  5. Sphinx Search consolidate
Logs are available for search after the initial Sphinx Search indexing occurs, but they must be consolidated to remain on the system for extended periods of time ("temp" indexes versus "permanent" indexes).  Each phase in the life of an inbound log requires varying amounts of CPU and IO time from the system which, together, create the overall maximum event rates for the system.


However, each phase does not use the same amount of IO resources versus CPU resources, and so some of the phases benefit greatly from having at least two CPU's available to run tasks concurrently.  Specifically, a separate CPU is used for Syslog-NG to parse logs versus elsa.pl to parse the output from Syslog-NG.  The loading of logs into MySQL and indexing of logs using Sphinx from MySQL both can occur on separate CPU's, meaning that a total of four CPU's could be used simultaneously, if available.  

Properly selecting an ELSA deployment architecture means providing enough CPU to a node (without wasting resources) as well as ensuring that there is enough available IO to feed those CPU's.  Below is a high-level comparison of which components use a lot of IO versus which use a lot of CPU.  It's far from scientific as represented here, but it does paint a helpful picture of what each component requires for understanding when specing a system.


As the diagram shows, receiving and parsing uses a lot of CPU but not much IO, whereas indexing uses more IO than CPU.  This is a big reason why running the indexing on the same system that is receiving logs makes a lot of sense.  If you separate out boxes into just parsers or just indexers, you are likely to waste IO on one and CPU on the other.  As long as the box you're using has four cores, there isn't a situation in which it helps to have a separate box do the parsing from the box doing the indexing. Separating the duties would only add unnecessary complexity.  If you do decide to split the workloads, be sure to load all ELSA components on both using standard ELSA installation procedures to avoid dependency pitfalls.

Search Components

What about on the search side of things?  Once the indexes are built and available, the web frontend will query Sphinx to find document ID's which correspond to individual events.  It will then take that list of ID's and retrieve them from MySQL.


Almost all of the heavy lifting is done by Sphinx as it searches its indexes for the full-text query given.  It will delve through billions of records and return a list of result doc ID's.  This list of (one hundred, by default) doc ID's are then passed to MySQL for full event retrieval.  The ID's are the MySQL tables' primary key, so this is a very fast lookup.  From a performance and scaling standpoint, ninety-nine percent of the work is done by Sphinx, with MySQL only performing row storage and retrieval.

Within Sphinx, a query is a list of keywords to search for.  Each resultant keyword represents a pseudo-table of result attributes which comprise ELSA attributes (host, class, source IP, etc.).  A very common search result will have a very large pseudo-table, and Sphinx will try to find the best match for the given table.  This means that even though the search is using an index, it could take a long time to find the right match if there are a lot of potential records to filter.  ELSA deals with this by telling Sphinx to timeout after a configured amount of time (ten seconds total, by default) with the best matches it has thus far.  This prevents a "bad" query from taking forever from the user's perspective, and if desired, the user can override this behavior with the timeout directive.

If a query has to scan a lot of these result rows, then the query will be IO-bound.  If it doesn't, then the query will complete in less than a second with very little CPU or IO usage.  It should be noted that temporary indexes do not contain the pseudo-tables, and therefore, queries against temporary indexes (which is almost always the case for alerts), execute in a few milliseconds.  So, the total amount of resources required for queries boils down to how many "bad" queries are issued against the system.  The more queries for common terms, the more IO required, which could cut into IO needed for indexing.

If IO-intensive queries will be frequent, then it might make sense to replicate ELSA data to "slave" nodes using forwarding.  Configuring ELSA to send its already-parsed logs to another instance will allow for that instance to skip the receiving and parsing step and just index records.  It can then serve as a mirror for queries to help share the query load.  This is not normally necessary, but could be desired in certain production environments.

Choosing the Right Hardware

My experience has shown that a single ELSA node will comfortably handle about 10,000 events/second, sustained, even with slow disk.  As shown above,  ELSA will happily handle 50,000 events/second for long periods of time, but eventually index consolidation will be necessary, and that's where the 10,000-30,000 events/second rate comes in.  A virtual machine probably won't handle more than 10,000 events/second unless it has fairly fast disk (15,000 RPM drives, for instance) and the disk is set to "high" in the hypervisor, but a standalone server will be able to run at around 30,000 events/second on moderate server hardware.

I recommend a minimum of two cores, but as described above, there is work enough for four.  RAM requirements are a bit less obvious.  The more RAM you have, the more disk cache you get, which helps performance if an entire index fits on disk.  A typical consolidated ("permanent") index is about 7 gigabytes on disk (for 10 million events), so I recommend 8 GB of RAM for best performance, though 2-4 GB will work fine.

RAM also comes into play in temporary index count.  When ELSA finds that the amount of free RAM has become too small or the amount of RAM ELSA uses has surpassed a configured limit (80 percent and 40 percent, by default, respectively), it will consolidate indexes before hitting its size limit (10 million events, by default).  So, more RAM will allow ELSA to have more temporary indexes and be more efficient about consolidating them.

In conclusion, if you are shopping for hardware for ELSA, you don't need more than four CPU's, but you should try to get as much disk and RAM as possible.

Sunday, March 24, 2013

ELSA Updates

ELSA has undergone some significant changes this month.  Here are the highlights for the most recent changelog:
  1. Parallel recursion for all inter-nodal communication
  2. Full web services API with key auth for query, stats, and upload
  3. Log forwarding via upload to web services (with compression/encryption)
  4. Post-batch processing plugin hook to allow plugins for processing raw batch files.
There have also been some important fixes, most prevalent being stability for indexing, timezone fixes, and the deprecation of the livetail feature until it can be made more reliable.  The install now executes a script which validates that the config is valid and attempts to fix the script where it can.  Additionally, it is now trivial to configure ELSA to store MySQL data in a specific directory (like under /data with the rest of ELSA) instead of in its native /var/lib/mysql location, which tends to be on a smaller partition than /data, using the new "mysql_dir" configuration directive.

The biggest difference operationally will be that all ELSA installations must have both the node and the web code installed unless the node will only be forwarding logs.  Logs will be loaded via the cron job that has previously only been used to execute scheduled searches.  Other than that, neither end users nor admins will see much of a change in how they use the system.  An exception is for orgs which had ELSA nodes in different locations which had high latency.  Performance should be much better for them due to the reduced number of connections necessary.

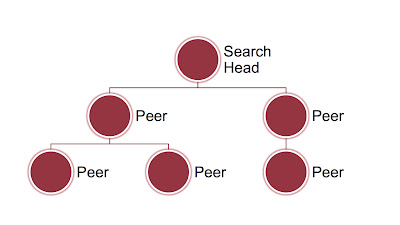
Architecturally, the new parallel recursion method allows for much more scalability over the older parallel model.  I spoke about this at my recent talk for the Wisconsin chapter of the Cloud Security Alliance.  The basic idea is that any node communicating with too many other nodes becomes a bottleneck for a variety of technical reasons: TCP handles, IO, memory, and latency. 
The new model ensures O(log(n)) time for all queries, as long as the peers are distributed in a evenly-weighted tree, as would normally occur naturally.  The tree can be bi-directional, with logs originating below and propagating up through the new forwarding system using the web services API.  An example elsa_node.conf entry to send logs to another peer would be:

{
  "fowarding": {
    "destinations": [ { "method": "url", "url": "http://192.168.2.2/upload", "username": "myuser", "apikey": "abc" } ]
  }
}

On the search side, to extend queries from one node down to its peers, you would tell a node to add a peer it should query to the peer list in elsa_web.conf:

{
  "apikeys": { "elsa": "abc" },
  "peers": {
    "127.0.0.1": {
      "url": "http://127.0.0.1/",
      "username": "elsa",
      "apikey": "abc"
    },
    "192.168.2.2": {
      "url": "http://192.168.2.2/",
      "username": "elsa",
      "apikey": "def"
    }
}

This will make any queries against this node also query 192.168.2.2 and summarize the results.

Generally speaking, you want to keep the logs stored and indexed as close to the source that generated them, as this will lend itself naturally to scaling as large as the sources themselves and will conserve bandwidth for log forwarding (which is negligible, in most cases).

Orgs with just a few nodes won't benefit terrifically from the scaling, but the use of HTTP communication instead of database handles does simplify both encryption (via HTTPS) and firewall rules with only one port to open (80 or 443) instead of two (3306 and 9306).  It's also much easier now to tie in other apps to ELSA with the web services API providing a clear way to query and get stats.  Some basic documentation has been added to get you started on integrating ELSA with other apps.

Upgrading should be seamless if using the install.sh script.  As always, please let us know on the ELSA mailing list if you have questions or problems!

Friday, February 22, 2013

Good News for ELSA

As seen on the ELSA mailing list:

Dear ELSA community,

I want to officially announce that I've taken a position with Mandiant Corporation. At Mandiant, I will continue work on ELSA.  ELSA will, of course, remain free and open-source (GPLv2), and I will continue to add features and bug fixes. Mandiant is working on building additional capabilities that rely on ELSA, and I am part of that effort.  

This is very exciting for both myself and the community!  It guarantees I will have time to work on ELSA, it means there will be a form of ELSA commercial support (details to follow at a later date), and it means that Mandiant is committed to making sure that ELSA will continue to be a strong, open source platform for years to come.

I also want to affirm what it does not mean:  ELSA will not become "hobbled."  There will not be "disabled" features in the web console, etc.  The additional capabilities we are building at Mandiant will be a separate, though related project.  I also want to reassure everyone that any patterns, plugins, or code contributed from the community will continue to go back into ELSA.

So, you can now know with certainty that there will always be a free, open source, and community supported ELSA!
 
As always, please don't hesitate to ask if you have any questions or concerns.

Thanks,

Martin